
This article describes how to drive a colour TFT display from uLisp. I ran it on an Adafruit ItsyBitsy M4, but it should work on any uLisp platform with enough memory.
I also include a demo curve-plotting program; you’ll need a 32-bit version of uLisp to run this as it needs floating-point arithmetic:
Introduction
I initially wrote this to test the new SPI routines in Version 2.8 of uLisp. For the display I used a 160x128 colour TFT display from AliExpress 1.8 inch TFT LCD Module 128x160 on AliExpress. Alternatively Adafruit have a very similar display 1.8" Color TFT LCD display on Adafruit.
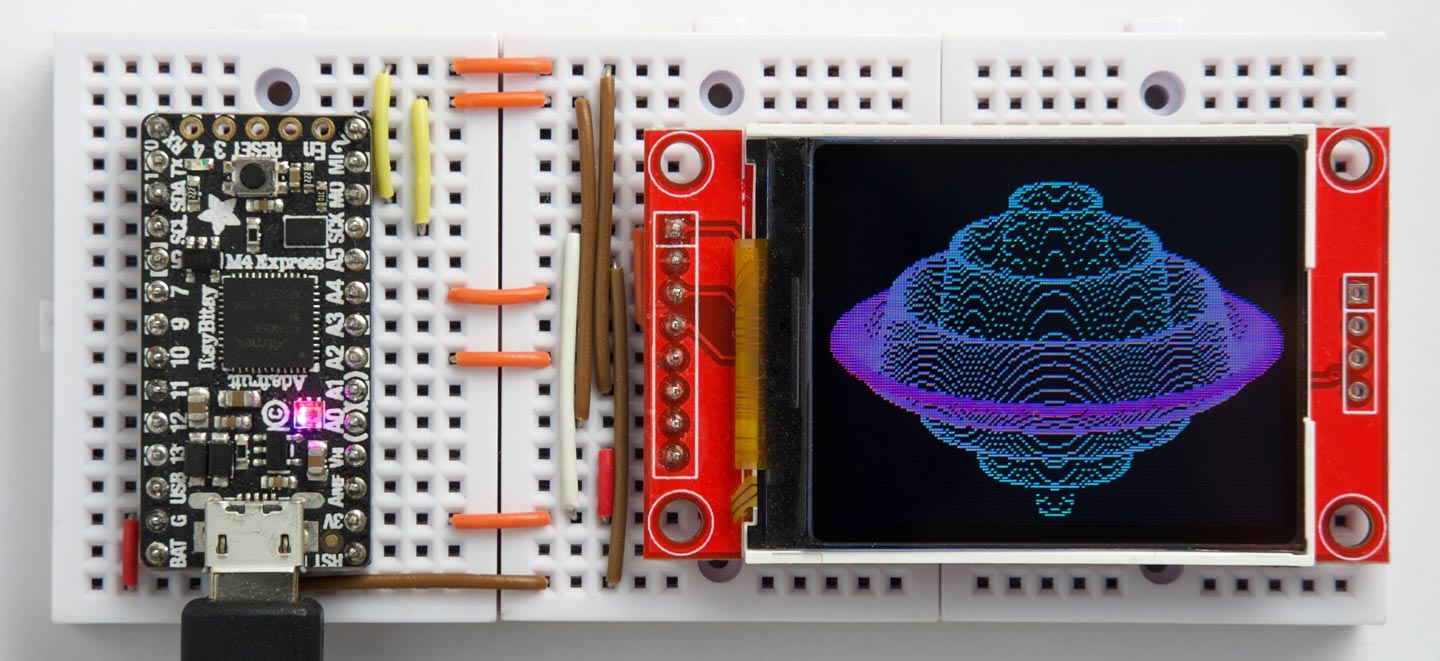
For the microcontroller board I used an Adafruit ItsyBitsy M4 (see Adafruit M4 boards), and the whole project fitted onto three mini breadboards clipped together.
Connect the ItsyBitsy to the TFT display using the following connections:
| AliExpress TFT Display | Adafruit TFT Display | ItsyBitsy M4 |
|---|---|---|
| VCC | VCC | 3V |
| GND | Gnd | G |
| CS | TFT_CS | A4 (pin 18) |
| RESET | RESET | 3V |
| AO | D/C | A2 (pin 16) |
| SDA | MOSI | MO |
| SCK | SCK | SCK |
| LED | LITE | 3V |
You can use any suitable pins for the CS and D/C connections to the display; I chose ones that were easy to wire across on the breadboard.
The program
First the program defines the pins used for the CS and D/C pins:
(defvar dc 16)
(defvar cs 18)
The next statements define the main display commands used by the routines:
(defvar CASET #x2A)
(defvar RASET #x2B)
(defvar RAMWR #x2C)
Finally four statements define the display dimensions and offsets relative to the display driver chip:
(defvar yoff 0)
(defvar xoff 0)
(defvar xsize 160)
(defvar ysize 128)
General routines
The display supports three alternative colour modes; I used the 16-bit 565 RGB mode which uses two bytes per pixel.
The rgb routine defines a colour based on its three components, each of which should be a number from 0 to 255:
(defun rgb (r g b)
 (logior (ash (logand r #xf8) 8) (ash (logand g #xfc) 3) (ash b -3)))
The cmd routine writes a command byte to the display, followed by a variable number of data bytes:
(defun cmd (c &rest data)
  (with-spi (str cs)
    (digitalwrite dc 0)
    (write-byte c str)
    (digitalwrite dc 1)
    (dolist (d data)
      (write-byte d str))))
Initializing the display
The init routine initialises the display:
(defun init ()
  (pinmode dc t)
  (cmd #x01)      ; Software reset
  (delay 150)     ; delay 150 ms
  (cmd #x11)      ; Out of sleep mode
  (delay 500)     ; delay 500 ms
  (cmd #x3A #x05) ; Set color mode - 16-bit color
  (cmd #x29)      ; Display on
  (delay 100))
If you enter (init) you should see a random bit pattern on the display.
Clearing the display
The routine clear clears the display:
(defun clear (&optional j)
  (let ((c (if j #xFF 0)))
    (cmd CASET 0 yoff 0 (+ yoff ysize -1))
    (cmd RASET 0 xoff 0 (+ xoff xsize -1))
    (cmd #x3A #x03)
    (cmd RAMWR)
    (with-spi (str cs)
      (dotimes (p (* (/ xsize 2) ysize 3))
        (write-byte c str)))
    (cmd #x3A #x05)))
By default it clears the display to black; to clear it to white give the command:
(clear t)
Plotting a point
Finally the point routine plots a point at specified coordinates x (from 0 to 159) and y ( from 0 to 127) in colour c:
(defun point (x y c)
  (cmd CASET 0 (+ yoff y) 0 (+ yoff y))
  (cmd RASET 0 (+ xoff x) 0 (+ xoff x))
  (cmd RAMWR (ash c -8) (logand c #xff)))
Demo curve plot
Finally, here’s the program I used to plot the curve shown at the beginning of the article:
(defun plot ()
  (let (m n)
    (dotimes (x 80)
      (let ((w (truncate (sqrt (- (* 80 80) (* x x))))))
        (dotimes (v (* 2 w))
          (let* ((z (- v w))
                 (r (/ (sqrt (+ (* x x) (* z z))) 80))
                 (q (* (- r 1) (sin (* r 24))))
                 (y (truncate (+ (/ z 3) (* q 64))))
                 (c (rgb (truncate (* r 255)) (truncate (* (- 1 r) 255)) 128)))
            (when
                (cond
                 ((zerop v) (setq m y) (setq n y))
                 ((> y m) (setq m y))
                 ((< y n) (setq n y))
                 (t nil))
              (point (- 80 x) (+ 64 y) c)
              (point (+ 80 x) (+ 64 y) c))))))))
It plots a surface of rotation, with hidden line removal to hide lines behind the surface. The program given above plots the equation:
q = (r - 1) * sin(24 * r)
where the sine function gives the rippled effect, and the (r - 1) causes the ripples to die away towards the edge of the curve. The colour of the lines changes as a function of r.
Here’s the whole program in a single file: TFT colour display plotting program.