This diminutive RP2040 board by Chinese manufacturer 01Space is an ideal board for running uLisp, and includes a 0.42" 72x40 OLED display for debugging or graphical output:
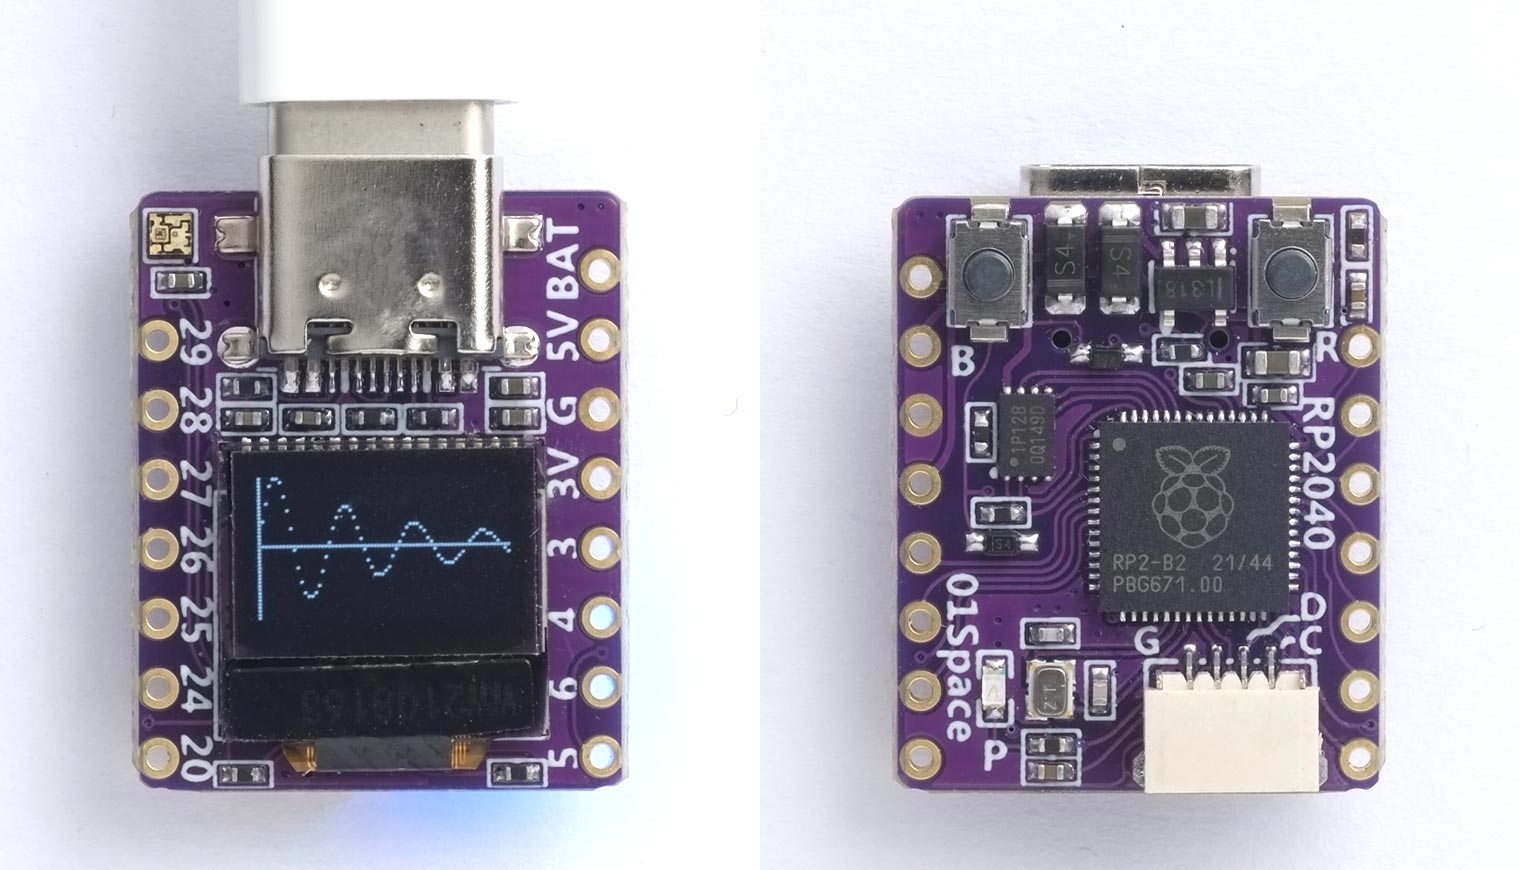
It includes 2MB of flash memory, a NeoPixel RGB LED, and a Stemma connector for connecting to I2C devices. It’s available from Banggood. For more details, and pin connections, see the 01Space GitHub page.
Installing uLisp from the Arduino IDE
Install the Raspberry Pi Pico/RP2040 core
-
Add the following URL to the Additional Boards Manager URLs list in the Arduino IDE Preferences dialog box:
https://github.com/earlephilhower/arduino-pico/releases/download/global/package_rp2040_index.json -
In the Arduino IDE search for the Raspberry Pi Pico/RP2040 core in Boards Manager and install it.
-
Select Raspberry Pi RP2040 Boards from the Board menu.
-
Select the Adafruit QT Py RP2040 board option.
There isn’t a specific board option for the 01Space board, but the QT Py RP2040 happens to have the correct I2C pin definitions for the OLED display.
-
Set Flash Size to 8MB (Sketch: 1MB, FS: 7MB).
This allocates enough space for use by LittleFS to save the entire workspace with save-image.
You can leave all the other options at their defaults.
Upload uLisp
- Download the latest ARM version of uLisp from the Download uLisp page.
- Upload uLisp to the board.
You should then be able to select the USB port from the Port menu, select Serial Monitor from the Tools menu, and enter Lisp commands.
Putting the board into upload mode
If the upload fails you may need to put the board into upload mode first.
- Press and hold the B (boot) button.
- Press the R (reset) button.
- Release the B button.
Using the display
The display is an 0.42" monochrome OLED display a resolution of 72x40, and based on an SSD1306 controller.
Initialising the display
The function (init) should be called first to initialise the display. The routines use the routine writebytes to write multiple bytes to the display via I2C:
(defun init ()
  (with-i2c (s 1 60)
    (writebytes s 0 #x8d #x14 #x20 #x01 #xd9 #xf1 #xad #x30 #xa1 #xaf)))

(defun writebytes (s &rest b)
  (dolist (i b) (write-byte i s)))
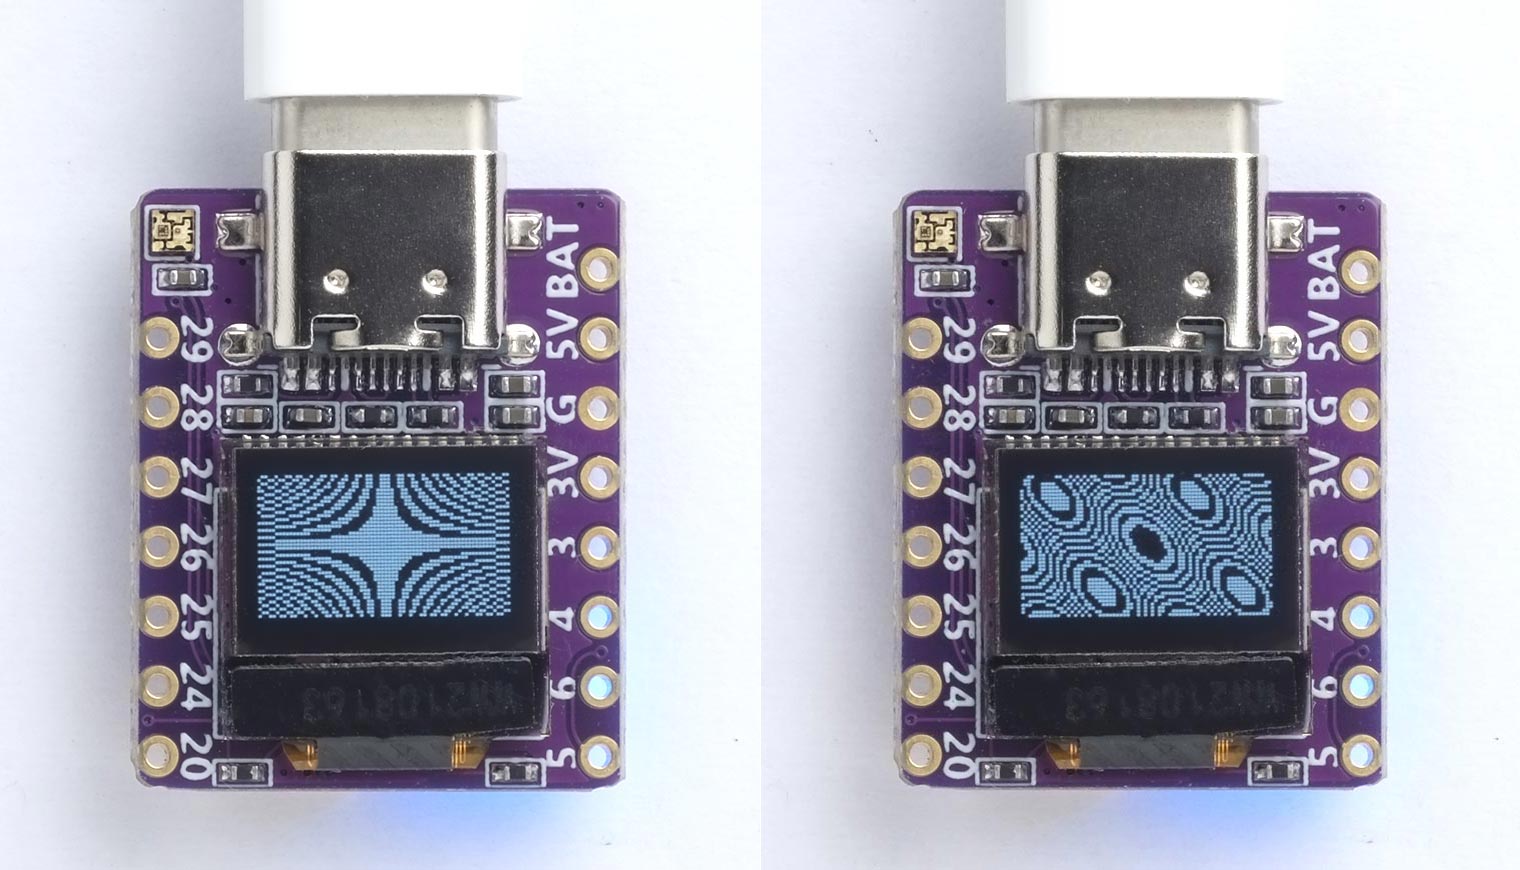
After calling (init) you should see a pattern of random dots on the display.
Plotting a point
You specify the position of the axes by the variables xa and ya; for example:
(defvar xa 36)
(defvar ya 20)
For no axes set xa and ya to -1.
The plot routine plot plots a point on the display at (x, y) where (0, 0) is the lower left corner of the display, x can be from 0 to 71, and y can be from 0 to 39. It uses the function set:
(defun set (yy byt)
  (if (<= 0 yy 7) (logior byt (ash 1 yy)) byt))

(defun plot (x y)
  (with-i2c (s 1 60)
    (writebytes s 0 #x21 (+ x 28) (+ x 28) #x22 0 4)
    (restart-i2c s)
    (write-byte #x40 s)
    (dotimes (p 5)
      (write-byte
       (if (= x xa) #xff
         (set (- ya (* p 8)) (set (- y (* p 8)) 0))) s))))
Note that because each byte of the display memory is mapped to a vertical column of 8 pixels, plotting a point will rewrite a complete column of 8 pixels.
This isn’t a problem for a function plotter, such as the following demo, because it only needs to plot one value of y for each value of x.
Demo program
Here’s the test routine, test, that draws a curve representing damped harmonic motion, as shown in the above photograph:
(defvar pi 3.14159)

(defun test ()
  (dotimes (x 72)
    (plot x (round (+ 20 (/ (* 22 (sin (/ x pi))) (exp (/ x 36))))))))
To run the demo do:
(init)
(test)
Clearing the display
This additional routine clear can be used to clear the display:
(defun clear () (dotimes (x 128) (plt x -1)))
Saving the program
Save the program with:
(save-image)
Resources
Here’s the whole program in a single file: Damped harmonic motion plot.