Simple data plotter for 128x64 OLED display


#1

Here’s a simple plotting function, written in uLisp, that will allow you to plot data to an Adafruit 128x64 monochrome OLED display, or any other compatible I2C display (based on an SSD1306 driver chip). It’s compact enough to run in uLisp on an Arduino Uno, with space to spare for the program to plot the data:

A restriction with this function is that it can only plot one value or pixel in each column. For many applications, such as plotting the value from a sensor against time, this is exactly what you want, so this minimal routine is ideal.
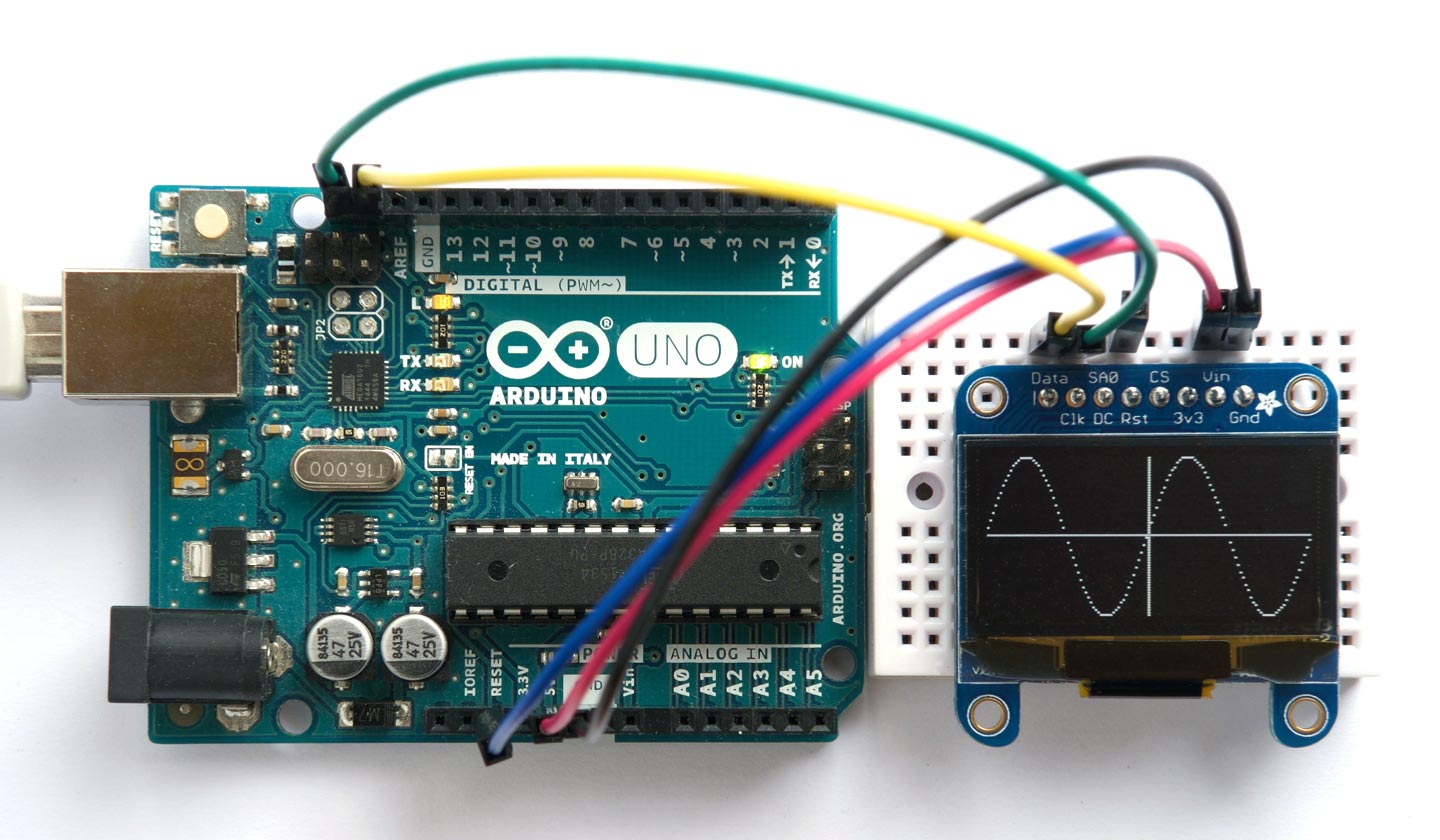
The circuit

Here’s the circuit:

The capacitor and resistor ensure the display is reset cleanly when power is applied.

The program

Here’s the program:

(defun wbs (s &rest b)
  (dolist (i b) (write-byte i s)))

(defun int ()
  (with-i2c (s 61)
    (wbs s 0 #x8D #x14 #x20 #x01 #xA1 #xAF)))

(defun plt (x y)
  (with-i2c (s 61)
    (wbs s 0 #x21 x x #x22 0 7)
    (restart-i2c s)  
    (write-byte #x40 s)
    (dotimes (p 8)
      (if (<= 0 y 7)
          (write-byte (ash 1 y) s)
        (write-byte 0 s))
      (setq y (- y 8)))))

The routine wbs writes multiple bytes to the display via I2C. The function (int) should be called first to initialise the display. The plot routine, (plt x y) then plots a point on the display at (x, y) where (0, 0) is the lower left corner of the display, x can be from 0 to 127, and y can be from 0 to 63.
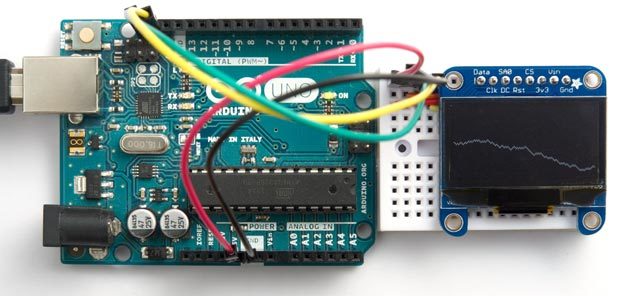
Demo program

Here’s the simple demo program I used to generate the display in the photograph:

(defun tst ()
  (int)
  (let ((y 32))
    (dotimes (x 128)
      (plt x y)
      (incf y (- (* 2 (random 2)) 1)))))

For more information and a C version of the program see my article on Technoblogy: Tiny Function Plotter


#2

I’ve updated the above (plt) routine with a slightly shorter version.

Also, here’s a function to clear the display:

(defun clr () (dotimes (x 128) (plt x -1)))

and a test program to draw a sine wave:

(defun tst ()
  (int)
  (let ((x 0) (y 2045))
    (dotimes (i 128)
      (incf x (/ (* y 16) 163))
      (decf y (/ (* x 16) 163))
      (plt i (+ 32 (ash x -6))))))

#3

I’ve recently improved these routines to add the option of adding axes to the plot:

As before the function (int) should be called first to initialise the display. The routines use the routine wbs to write multiple bytes to the display via I2C:

(defun int ()
  (with-i2c (s 61)
    (wbs s 0 #x8D #x14 #x20 #x01 #xA1 #xAF)))

(defun wbs (s &rest b)
  (dolist (i b) (write-byte i s)))

You specify the position of the axes by defining variables xa and ya; for example:

(defvar xa 64)

(defvar ya 32)

For no axes set xa and ya to -1.

Here’s the revised plot routine plt. It uses the function set:

(defun set (yy byt)
  (if (<= 0 yy 7) (logior byt (ash 1 yy)) byt))

(defun plt (x y)
  (with-i2c (s 61)
    (wbs s 0 #x21 x x #x22 0 7)
    (restart-i2c s)  
    (write-byte #x40 s)
    (dotimes (p 8)
      (write-byte
       (if (= x xa) #xff 
         (set (- ya (* p 8)) (set (- y (* p 8)) 0))) s))))

Here’s the test routine, tst, that draws the sine wave in the photograph:

(defun tst ()
  (let ((x 0) (y 2045))
    (dotimes (i 128)
      (incf x (/ (* y 16) 163))
      (decf y (/ (* x 16) 163))
      (plt i (+ 32 (ash x -6))))))

These routines all fit on an Arduino Uno (just).